프로그래밍 언어/R
[R] plot : 그래프 타입 종류
sujo
2022. 12. 20. 10:37
[R] plot : 그래프 타입 종류
사용 데이터
1) women 데이터셋
- R에서 제공하는 기본 데이터셋
- 30~39세의 미국 여성의 평균 키와 몸무게에 대한 데이터
|
1
2
|
?women
str(women)
|
cs |
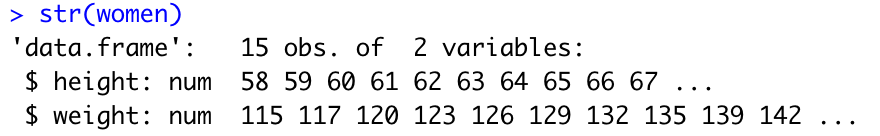
2) plot으로 간단한 차트 그리기
- x축 : weight
- y축 : height
|
1
|
plot(women$weight, women$height)
|
cs |
그래프 타입 종류
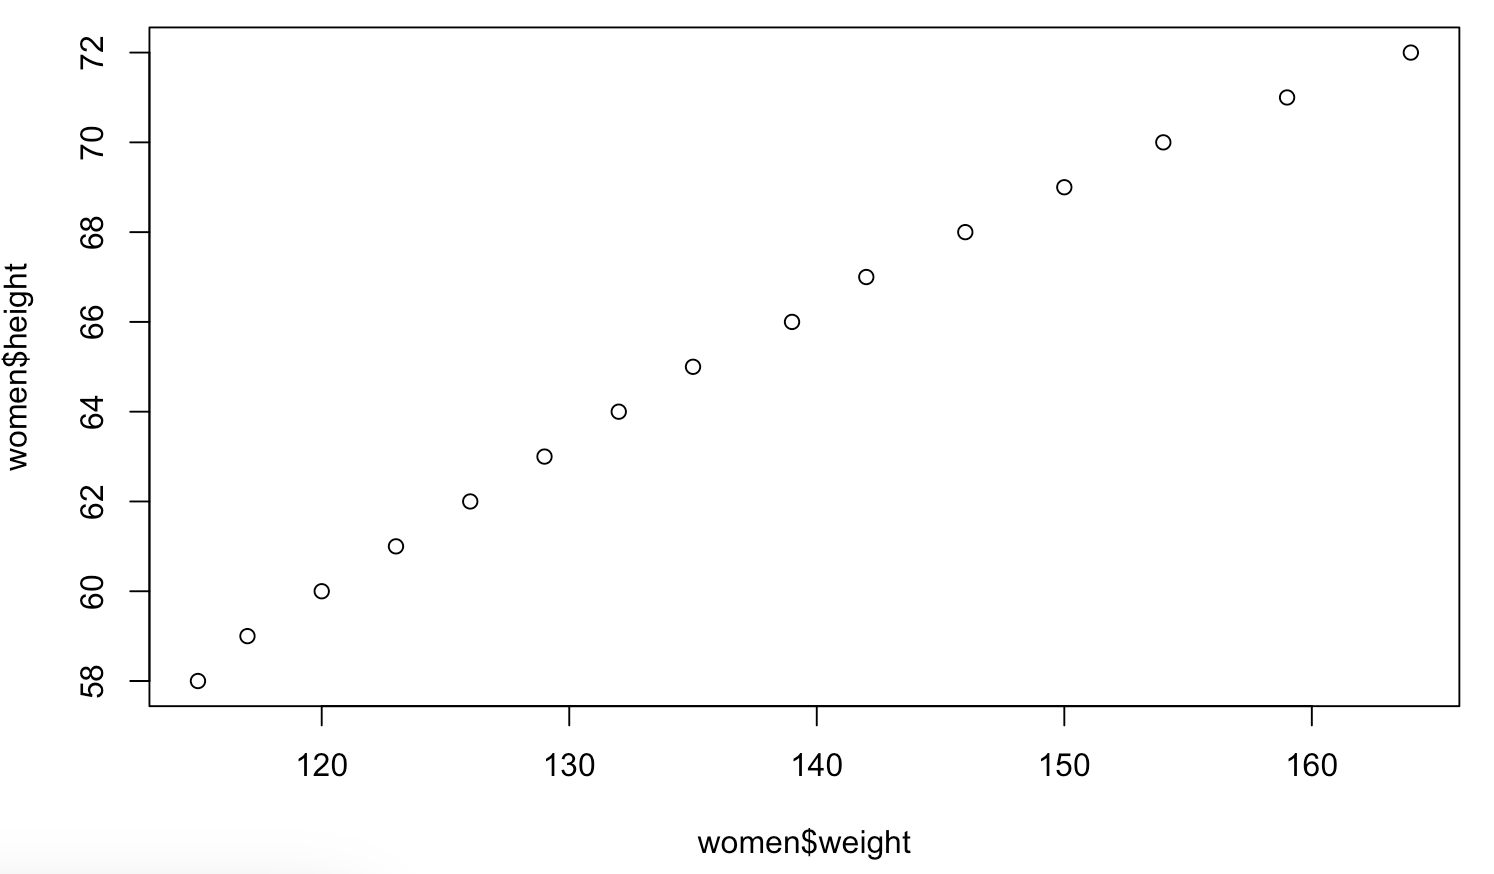
1) tpye = "p"
- 기본(default)
|
1
|
plot(women$weight, women$height, type = "p")
|
cs |

2) type = "l"
- 선 그래프
|
1
|
plot(women$weight, women$height, type = "l")
|
cs |

3) type = "b"
- 선 그래프에 점 찍기
|
1
|
plot(women$weight, women$height, type = "b")
|
cs |

4) type = "o"
- 선 그래프 위에 점 찍기
|
1
|
plot(women$weight, women$height, type = "o")
|
cs |

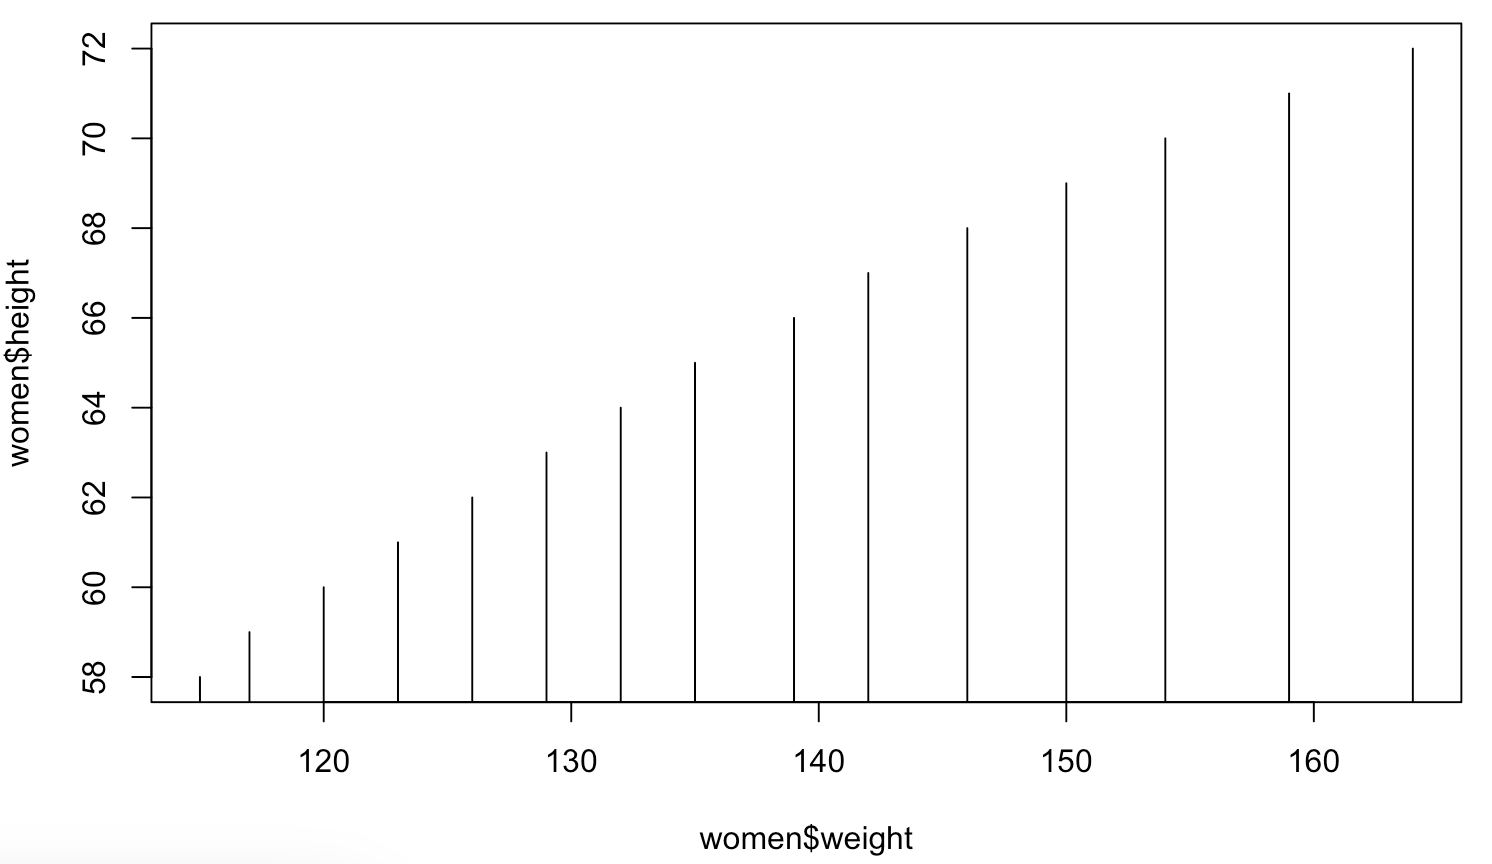
5) type = "h"
- 수직선 그리기
|
1
|
plot(women$weight, women$height, type = "h")
|
cs |
6) type = "s"
- 계단식 그래프 (수평선 먼저)
|
1
|
plot(women$weight, women$height, type = "s")
|
cs |

7) type = "S"
- 계단식 그래프 (수직선 먼저)
|
1
|
plot(women$weight, women$height, type = "S")
|
cs |

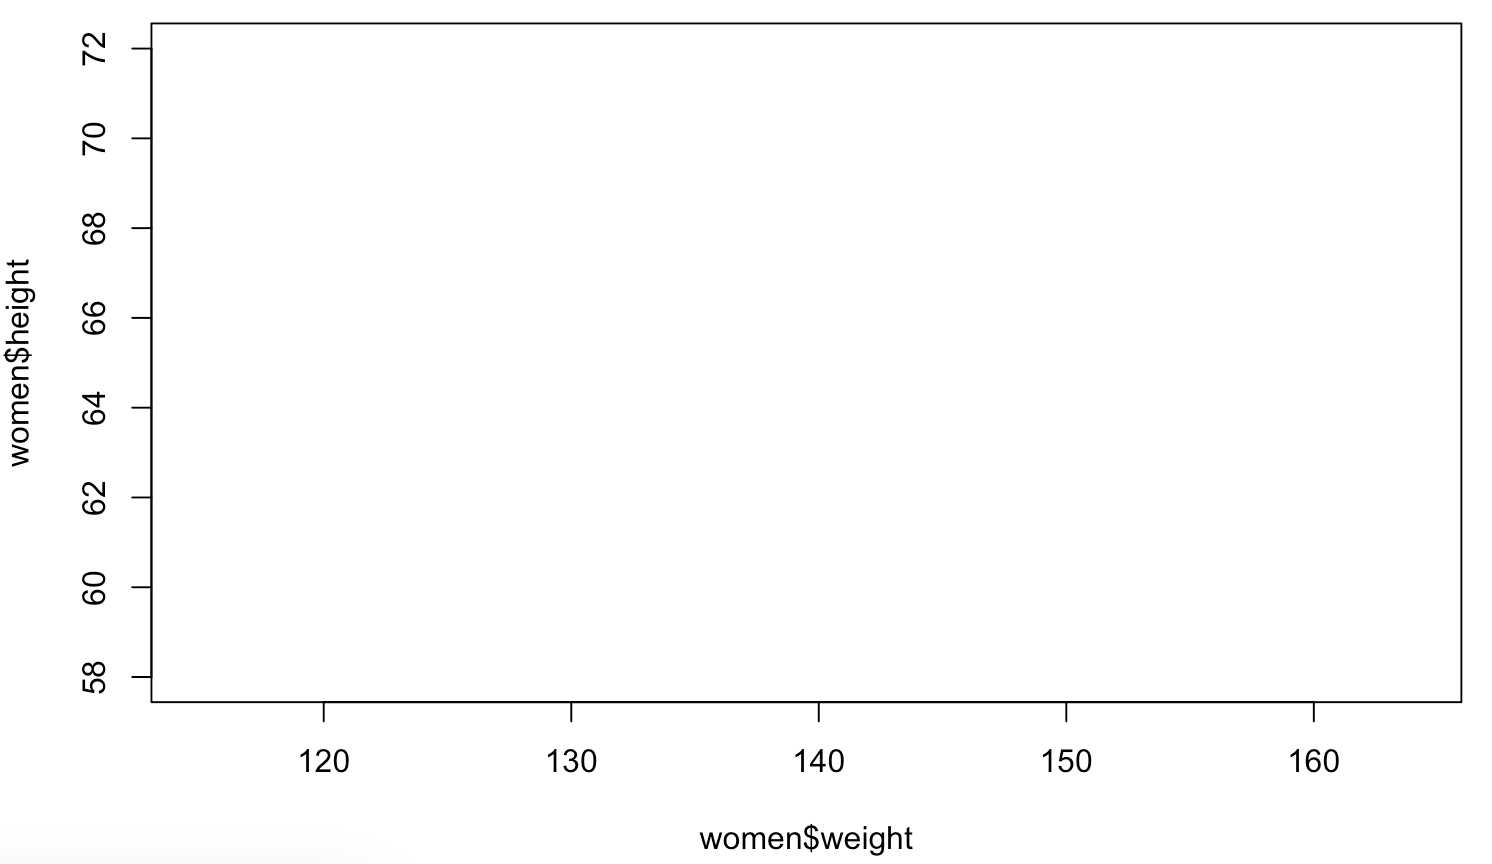
8) type = "n"
- 선 없음
|
1
|
plot(women$weight, women$height, type = "l")
|
cs |